PG Scope: Clear Website Analytics, Visitor Journeys, and AI Traffic — Without the Usual Complexity
Most website analytics tools are very good at producing numbers. The harder part is understanding what those numbers actually mean. PG Scope was built to make website activity easier to understand at a glance — from individual visitor journeys and active time to AI referral traffic, search sources, location, long-term trends, and private mobile reporting.
See What Is Actually Happening on Your Website
PG Scope gives you a practical view of how people are using your website without forcing you to dig through layers of complicated reports. The Overview screen brings together visits, visitors, page views, traffic sources, and trends in one place.
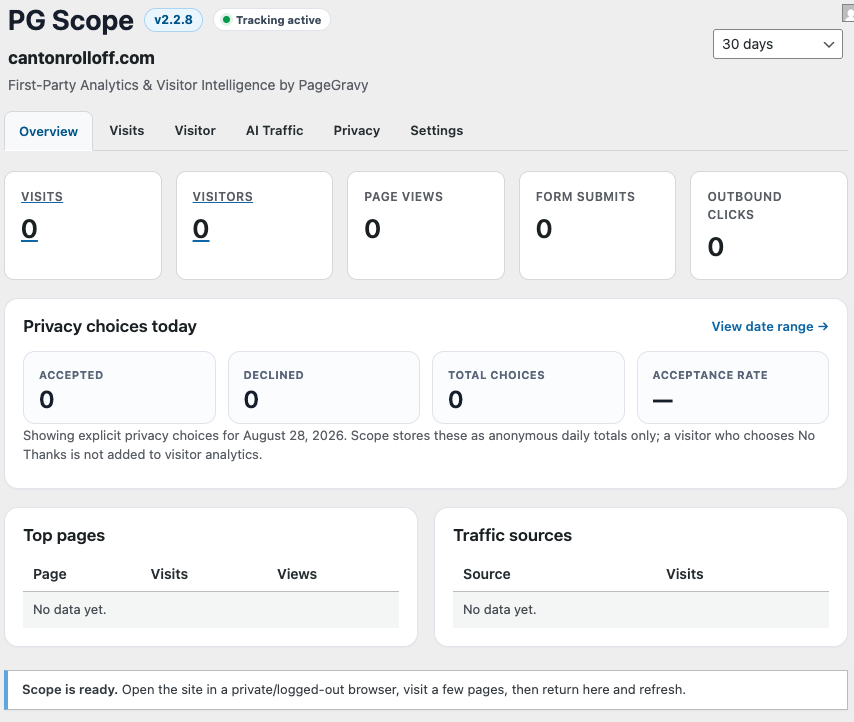
The PG Scope Overview gives you a fast read on site activity without burying the important information.
Visits and Visitors
See how many visits happened, how many anonymous visitors were involved, and how those visitors moved through the site.
Page Views
Understand which pages are actually being viewed and avoid misleading reporting caused by incomplete or blank URL data.
Traffic Sources
See where visits came from, including search engines, referring websites, direct traffic, and recognizable AI platforms.
Long-Term Trends
Use Today, Yesterday, 7 Days, 30 Days, 90 Days, 6 Months, or a custom date range to see how traffic changes over time.
Follow the Visitor Journey, Not Just the Page Count
A visitor and a visit are not the same thing. Someone may browse several pages in one session, leave, and return later. PG Scope is designed to keep those ideas separate while still connecting the dots.
When the same anonymous visitor moves through multiple pages without more than 30 minutes of inactivity, Scope treats that activity as one logical visit. If the same anonymous visitor comes back later, it becomes a new visit — while the Visitors view still lets you see the broader history for that anonymous visitor.
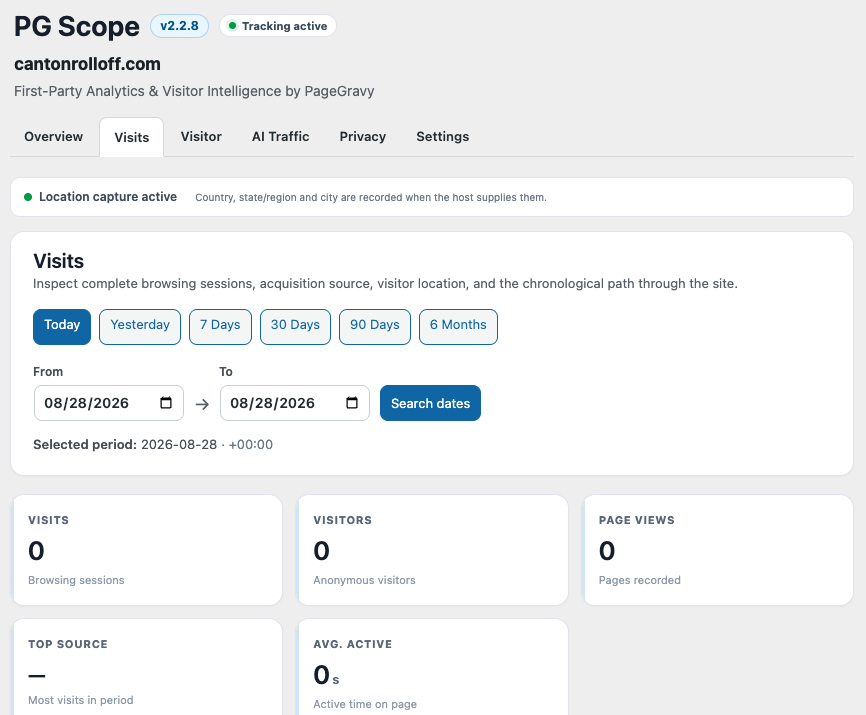
The Visits screen shows the sequence of pages, source, geography, device details, and engagement for a visit.
Connect Repeat Activity From the Same Anonymous Visitor
Scope also provides a Visitors view so you can see when multiple visits belong to the same anonymous browser or device. That makes it much easier to understand whether someone looked at one page and disappeared or returned later to continue exploring.
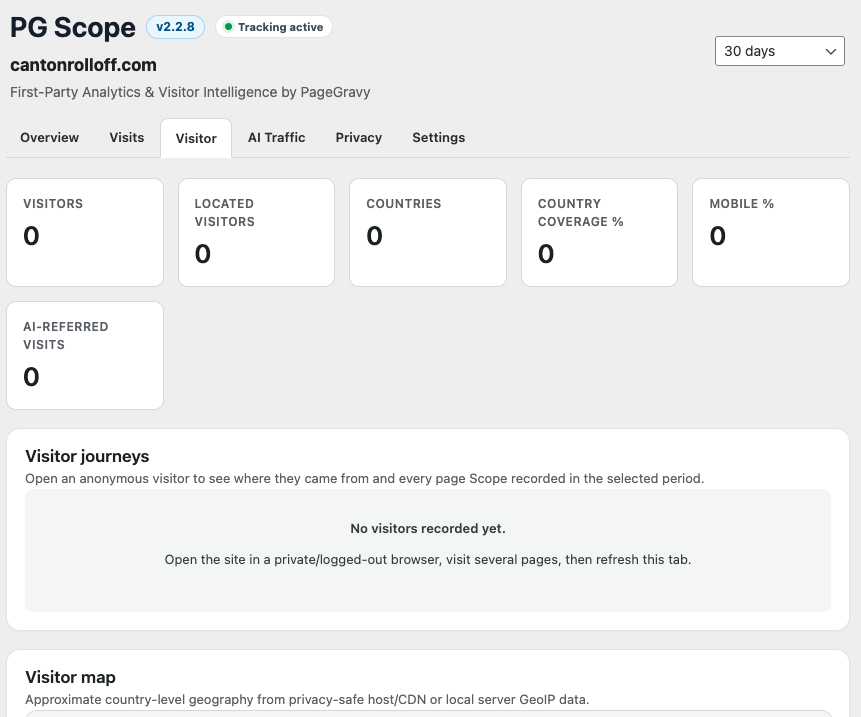
The Visitors screen connects related activity without claiming to know the visitor’s real-world identity.
See AI Traffic Alongside Search and Referral Traffic
Search traffic is no longer the whole story. People are increasingly discovering websites through AI tools and answer engines. PG Scope can identify recognizable referral traffic from platforms such as ChatGPT, Gemini, Perplexity, Claude, Copilot, and other sources when referral information is available.
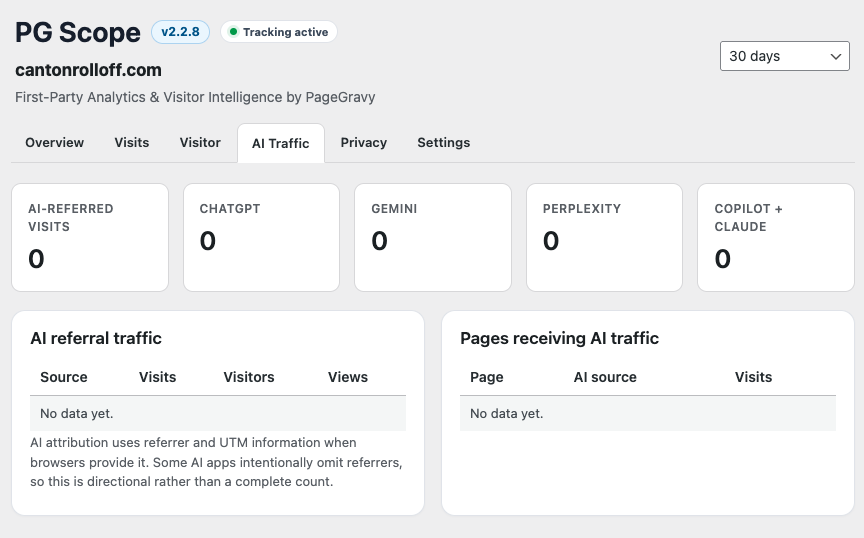
AI traffic is reported alongside traditional search, referral, and direct sources so you can see how discovery is changing.
Measure Active Time, Not Just Arrival and Departure
A visit lasting five minutes does not necessarily mean someone actively used the website for five minutes. PG Scope measures visible-tab active time so background tabs do not artificially inflate engagement.
That gives you a more useful picture of how long visitors were actually interacting with the website and which pages held their attention.
Approximate Location Without Turning Analytics Into Identity Tracking
When the hosting environment provides location information, Scope can show approximate country, state or region, and city. Location data is intended to help understand geographic demand — not identify a visitor by name.
Scope also includes Location Diagnostics so the site administrator can verify whether the server is supplying geographic information. On supported Hostinger environments, Scope can even check the root .htaccess file for GeoIPEnable On and report whether the directive is present.
Six Months of Reporting With Charts That Stay Readable
PG Scope supports date ranges up to six months for active reporting. Presets make it easy to switch between Today, Yesterday, 7 Days, 30 Days, 90 Days, and 6 Months, or choose a custom From/To range.
The Visits and Page Views chart automatically adapts to the amount of time selected. Short ranges can be viewed by day, medium ranges by week, and longer ranges by month, so a six-month report does not turn into an unreadable wall of daily bars.
A Private iPad and Mobile Dashboard
Website owners do not always want to log into WordPress just to check activity. Scope includes a private, read-only dashboard designed for an iPad, tablet, phone, or regular browser.
The private dashboard shows the actual website name, recent traffic, visits, visitors, page views, sources, charts, journeys, active time, and selectable date ranges while keeping WordPress administration completely out of the way.
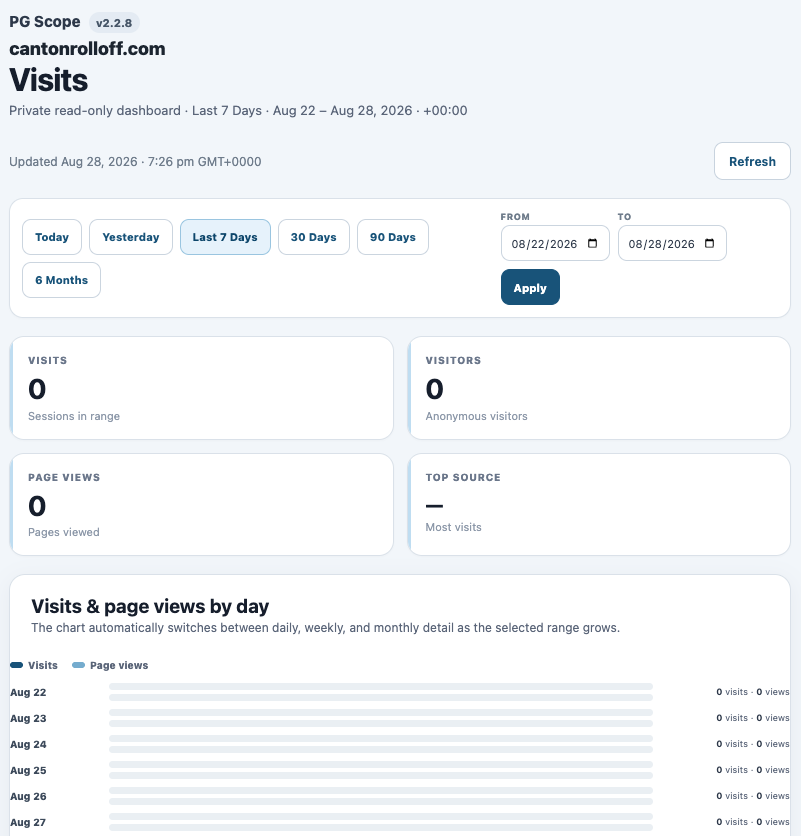
The private Scope dashboard makes it easy to check website activity from an iPad or mobile device without entering wp-admin.
Built-In Privacy Controls
PG Scope includes optional first-party analytics consent controls. When the privacy choice is enabled, Scope analytics do not begin until the visitor accepts them. Visitors who choose No Thanks are not recorded by Scope analytics unless they later change their choice.
Anonymous acceptance and decline totals can also be reported without creating a visitor profile for someone who declined analytics.
The privacy settings are intentionally part of the system, but they do not need to dominate the reporting experience. The goal is to give website owners useful analytics while making the visitor’s choice clear.
Keep Internal Traffic Out of the Numbers
One of the easiest ways to distort website analytics is to count the site owner, staff, or developers as normal visitors. PG Scope can exclude internal traffic by IP address or by marking a browser as excluded.
WordPress administrators are also excluded from tracking, helping keep testing, editing, and routine site maintenance out of the real visitor numbers.
First-Party Data Inside WordPress
PG Scope is designed as first-party website analytics. The reporting lives inside WordPress rather than requiring the site owner to work inside a separate analytics platform for everyday questions.
Scope can also remove direct Google Analytics tracking code from the public site when that code has been installed directly, helping prevent duplicate analytics systems from running at the same time.
Data Retention That Fits Real Reporting
The current Scope builds use a 365-day default retention period for analytics data. That gives website owners enough history to compare longer-term changes while still keeping retention controlled and configurable.
What PG Scope Helps You Answer
- How many people are actually visiting the website?
- Which pages are they viewing?
- What path did a visitor take through the site?
- Did they actively spend time on those pages?
- Did they arrive from Google, Bing, an AI platform, another website, or directly?
- Which AI tools are beginning to send traffic?
- What country, state, or city is traffic coming from when location information is available?
- Did the same anonymous visitor return later?
- How are visits and page views changing over several weeks or months?
- Can I check all of this quickly from an iPad without logging into WordPress?
Analytics Should Help You Understand the Website
Analytics are most useful when they answer practical questions. PG Scope was built around that idea: show the website owner what happened, where visitors came from, what they looked at, how long they were actively engaged, and whether they came back — without making the reporting harder than the website itself.
PG Scope by PageGravy
PG Scope is being developed by PageGravy as a practical website analytics platform for WordPress, with visitor journeys, AI traffic reporting, active-time measurement, privacy controls, long-term reporting, and private mobile access built into one system.
Want to know what people are actually doing on your website — and how AI is starting to send traffic your way? PG Scope is built to show you.